Services
Water Use Data
Understanding our water usage patterns is essential for the sustainable management of Aquifer 560. By tracking our water consumption, we gain insights into trends, identify areas for improvement, and ensure efficient allocation for both present and future needs. Moreover, sharing our daily and annual water use helps to keep water conservation top of mind and encourages us all to reduce our water use to help minimize the strain on our infrastructure and the environment.
*Please note that the calculation of water use differs across the region. Being a tourist destination, our population fluctuates, so calculating the per capita use based on the volume withdrawn from the aquifer divided by the census population is inaccurate. The Town of Gibsons instead calculates the full volume of water withdrawn daily, rather than per capita use.

*Note: Water use was higher than usual from January to April 2024 due to a water leak. Staff noticed the unusually high numbers and compared well production data to metered consumption data. Within a week of detecting the leak, crews found and fixed the issue.
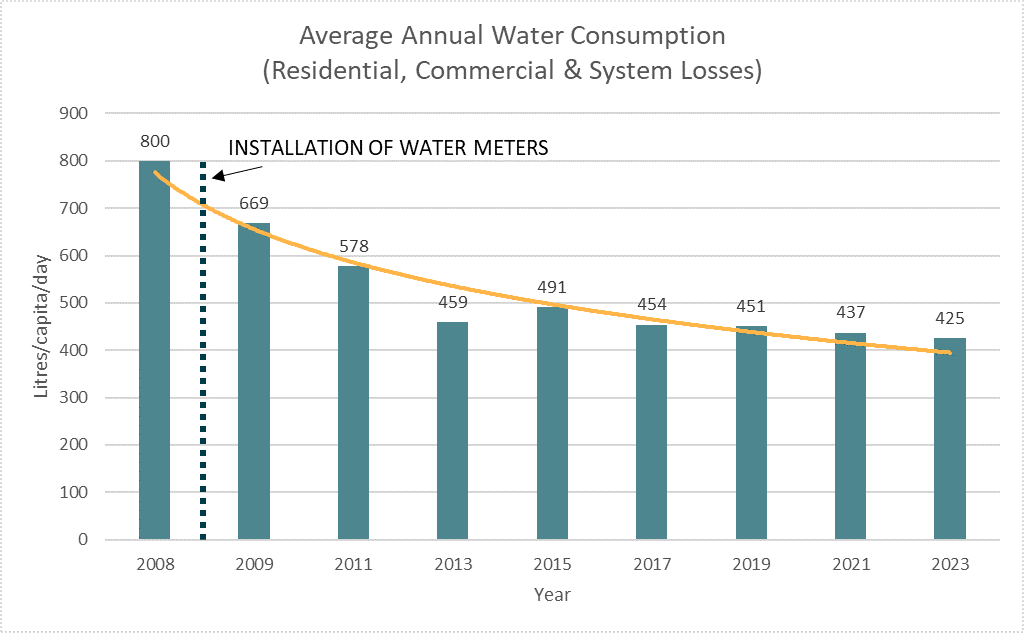
Average Annual Water Consumption
Since Gibsons installed water meters in 2009, water use has significantly decreased. Meters help to conserve water by indicating leaks on private systems and also assist us in tracking leaks in the municipal pipe system and allow users to control what they pay.
The following chart shows the average annual water consumption in Litres/capita/day